
Industry and Infrastructure
What is the PMI Index?
WHAT?
The Purchasing Managers' Index (PMI) is an economic indicator derived from monthly surveys of private sector companies. It reflects the prevailing direction of economic trends in manufacturing and services sectors.
Who publishes PMI in India?
- Compiled by: S&P Global (formerly IHS Markit)
- Published for India by: S&P Global
- Not released by government bodies like MOSPI or RBI
Types of PMI in India
| PMI Type | Sector Covered |
|---|---|
| Manufacturing PMI | Factories, industrial output |
| Services PMI | Banking, IT, hospitality, etc. |
| Composite PMI | Weighted average of Manufacturing & Services PMI |
How is PMI Calculated?
Based on responses to 5 key components from a survey of purchasing managers:
- New orders
- Output (production)
- Employment
- Supplier delivery times
- Inventories of purchases
Each component is assigned a weight, and the PMI is calculated as a diffusion index.
PMI Value Interpretation
| PMI Value | Economic Signal |
|---|---|
| > 50 | Expansion in economic activity |
| = 50 | No change (neutral) |
| < 50 | Contraction in activity |
Higher the value above 50, stronger the expansion.
Example
If India’s Manufacturing PMI rises from 52.0 to 55.5 in a month:
- It indicates stronger expansion in factory activity
- May lead to positive investor sentiment
- Could influence RBI to consider inflation-growth trade-offs
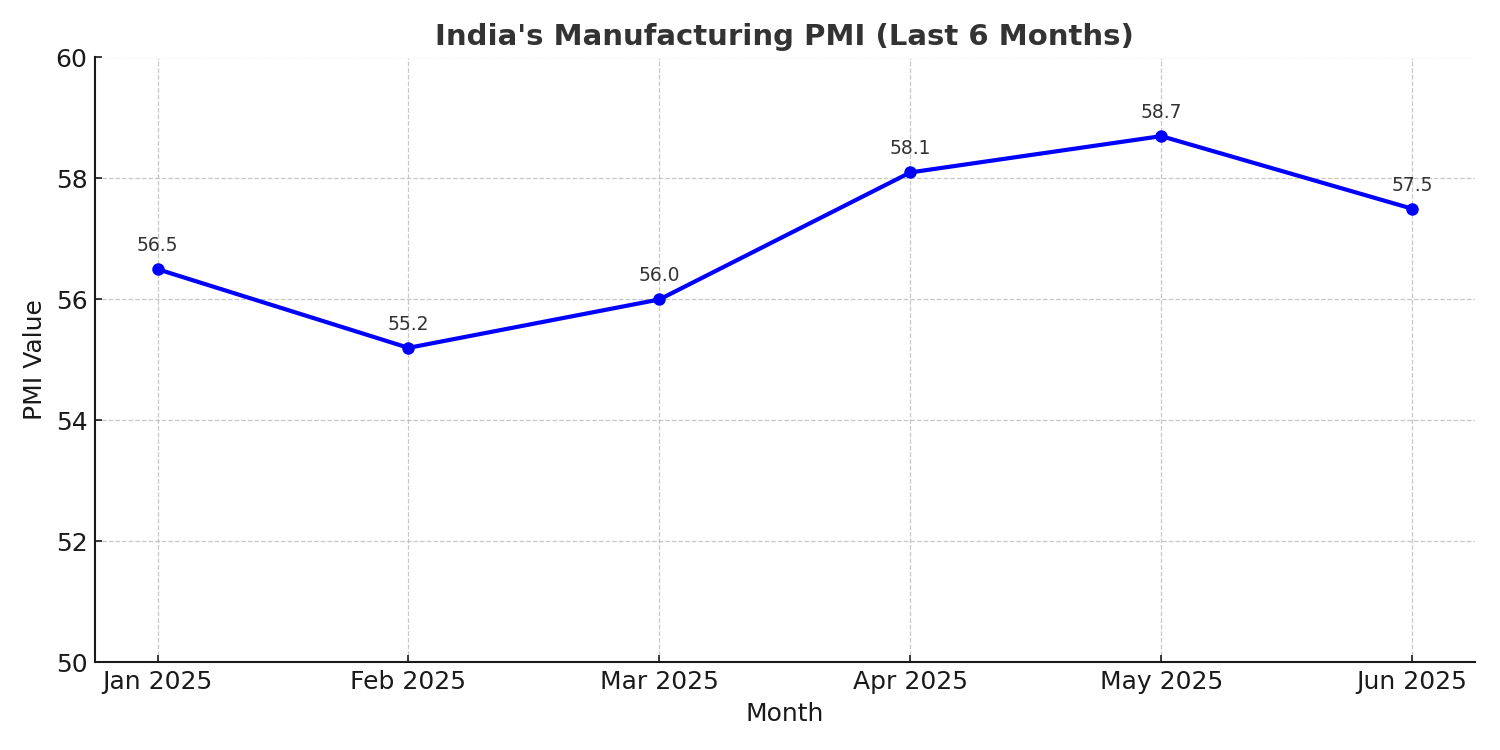
INDIA'S Manufacturing PMI in last 6 months
PMI vs Other Indicators
| Aspect | PMI | IIP / GDP |
|---|---|---|
| Frequency | Monthly | IIP (monthly), GDP (quarterly) |
| Timeliness | Very timely (early signal) | Often delayed |
| Based On | Survey (perception-based) | Actual data (fact-based) |
| Sector Coverage | Manufacturing/Services | Entire economy (incl. agri.) |
Why is PMI Important?
- Leading Indicator: Signals future economic performance before GDP/IIP data
- Monetary Policy Signal: Central banks use it to gauge inflation/slowdown risks
- Investor Sentiment: Triggers market reactions in equity and currency markets
About author

Zinkpot — We Inform, You Perform.
Ask Anything, Know Better
अपना प्रश्न पूछें
-
Third Round of PLI for Specialty Steel: Boosting India’s High-Tech Manufacturing
November 05 Introduction India's government is making it easier for small businesses to join a program that boosts steel production. On November 4, 2025, Union Steel Minister H D Kumaraswamy launched the third round of the Production Linked Incentive (PLI) scheme for specialty steel. This round, called PLI 1.2, aims to attract big investments and help make India a world leader in high-quality steel. In this article, we'll explain what the scheme is, the new changes for MSMEs (Micro, Small, and Medium Enterprises), its details, benefits, and...
-
What is DISTRICT DOMESTIC PRODUCT (DDP)? BENEFITS?
November 05 Introduction Have you ever wondered how we measure a country's economy? We use GDP, or Gross Domestic Product, which shows the total value of goods and services made in the whole country. But what if we zoom into smaller areas, like districts? That's where District Domestic Product (DDP) comes in. It's like GDP but for each district in a state or country. In India, DDP is gaining attention as a way to understand local economies better. This article explains what DDP is, if it's coming soon, its benefits, and why it...
-
What is the Design Linked Incentive (DLI) Scheme?
November 03 What ? The Design Linked Incentive (DLI) Scheme is a program by the Indian government to help grow the country's semiconductor design industry. Semiconductors are tiny chips used in electronics like phones, computers, and cars. India wants to become a leader in designing these chips instead of just buying them from other countries. The scheme gives money and tools to Indian companies, startups, and small businesses (MSMEs) that work on chip designs. It started in December 2021 and is run by the Ministry of Electronics and...
-
What is Railway's Door-to-Door Cargo Services?
October 20 Overview In today's busy world, moving goods from one place to another is key for businesses. Railways, like Indian Railways or big US ones, now offer "door-to-door" cargo services. This means they pick up your stuff right from your doorstep, transport it by train, and deliver it to the final spot—no need for you to handle the middle parts. It's like a full package deal for shipping. What is Door-to-Door Cargo? Door-to-door cargo service is when a railway company handles everything for your...
-
What are Logistics Parks?
October 14 What is logistics all about? Logistics include all the activities that go in transporting goods from one place to another. it includes services like loading, handling, transporting, unloading and delivering at the specified address. What Are Logistics Parks? Logistics parks are special areas built for handling goods and making supply chains work smoothly. They are like big hubs where companies can store, pack, process, and move products all in one place. These parks include warehouses, offices,...
-
What is India's 4G Stack? A Step Towards Self-Reliant Telecom?
October 13 What is 4G Stack? India is working hard to become self-reliant in many areas, and telecom is one of them. The indigenous 4G stack is a homegrown technology for mobile networks. It's made by Indian companies and is being used by BSNL, the government-owned telecom firm. This stack helps provide 4G internet without depending on foreign companies. It was launched in a big way in September 2025, and it's already connecting millions of people, especially in rural areas. In simple words, a "4G stack" is like...
-
What is China's Digital Silk Road?
October 13 What is? China's Digital Silk Road (DSR) is like a big tech highway that connects countries around the world. It's part of China's larger plan called the Belt and Road Initiative (BRI), which started in 2013 to build roads, ports, and other things between countries. The DSR focuses on digital stuff, like internet cables, 5G networks, AI, and smart cities. It was officially launched in 2015, and by 2025, it's celebrating its 10th birthday. China wants to help other countries build better tech systems while also...
-
GeM portal and what is GeM 5.0?
October 10 What is GeM Portal? The Government e-Marketplace (GeM) portal is an online platform created by the Government of India for public procurement of goods and services. It was launched on August 9, 2016, by the Ministry of Commerce and Industry to make buying and selling for government departments more transparent, efficient, and fast. GeM is a paperless, cashless, and contactless system that helps central and state government offices, public sector units (PSUs), and local bodies buy common items like office supplies, vehicles,...
-
What is Zero Defect Zero effect scheme (ZED)?
October 10 What is ZED? The Zero Defect Zero Effect (ZED) scheme is an Indian government program started in 2016 to help small and medium businesses (called MSMEs) make high-quality products without harming the environment. The name "Zero Defect" means products should have no mistakes or flaws, and "Zero Effect" means the manufacturing process should not pollute or damage nature, like reducing waste and using clean energy. It was launched by the Ministry of Micro, Small and Medium Enterprises (MSME) and promoted by...
-
Key points about Visvesvaraya Plan (1934) and Bombay Plan (1944)
October 07 Visvesvaraya Plan (1934) Is one of India’s earliest modern economic planning ideas by M. Visvesvaraya (engineer & statesman, author of Planned Economy for India) in his book Planned Economy for India (1934). The plan came before the official Planning Commission era (pre-Independence). It aimed to transform India from an agricultural to an industrial economy and double national income in 10 years. Key Points Shift from Agriculture to Industry : Urged rapid industrialisation to absorb surplus...
- 1 RBI Digital Rupee e₹ क्या है? बिना Internet पेमेंट! कैसे इस्तेमाल करें Digital Rupee vs UPI April 15
- 2 About Trade Policy Uncertainty (TPU) Index and Global Economic Policy Uncertainty (GEPU) Index April 08
- 3 What is Food Credit and Non Food Credit? April 08
- 4 SARFAESI Act, 2002 Vs Insolvency & Bankruptcy Code (IBC), 2016 : Main Differences April 08
- 5 IN Skip navigation Search Sign in Transgender Bill 2026: क्या अब डॉक्टर तय करेंगे आपकी पहचान? NALSA से अब तक पूरा मामला April 01
- 6 80 लाख लोग सड़कों पर March 31
- 7 Iran US War: Strait of Hormuz के बाद Bab al-Mandeb Strait बंद हुआ तो दुनिया रोएगी | Zinkpot March 28
- 8 LPG vs CNG vs PNG | कौन सी गैस सबसे SAFE? Gas Crisis | Iran War | Zinkpot March 27
- 9 IPL 2026 सबसे बड़ा महामुकाबला । Maximum Teams, Prizes and Matches l Zinkpot March 26
- 10 Iran War 2026: ट्रंप की 48 घंटे की डेडलाइन खत्म… अब क्या होगा? March 25
- 11 USA LOST Dubai Trust? | Dubai अब Safe नहीं? | Iran War | ZINKPOT March 25
- 12 “मैं जिंदा हूं” – Netanyahu | Iran Nuclear Power खत्म? | IRAN War Update March 21
- 13 Iran war: Larijani killing Revenge | Iran Bombards Saudi Oil Refineries | Is this World War - 3 March 20
- 14 Israel–Iran Conflict Explained | क्या ये धर्म की लड़ाई है? | Middle East War Analysis March 19
- 15 IRAN WAR: TRUMP बेबस | Trump ने China से मांगी मदद | Strait of Hormuz संकट । Geopolitics March 17
- 16 Iran vs USA War: Operation Epic Fury पर उठे सवाल | Trump की बड़ी रणनीतिक गलती? March 16
- 17 IRAN WAR: Mojtaba Khamenei’s First Message | “हर मौत का बदला होगा” US-Israel को खुली चेतावनी March 14
- 18 IRAN WAR: जंग की लपटें रसोई तक | LPG CRISIS का संकट ! आख़िर कब तक March 13
- 19 IRAN WAR: AMERICA BLIND | क्या US Radar अब बेकार? March 12
- 20 What does Trump want from Iran? March 11
Comments
Write Comment