Taxation
What is Tax elasticity and Tax buoyancy?
Tax Buoyancy
- Tax buoyancy tracks the percentage change in tax revenue against a 1% change in nominal GDP.
- It reflects the change in the Tax collection with the change in the national income or the GDP.
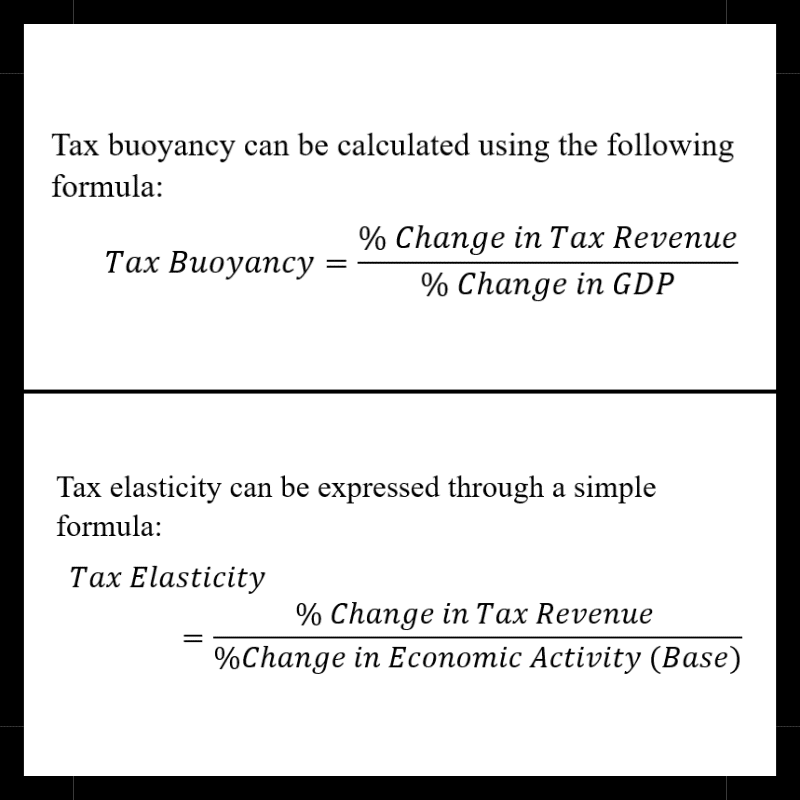
- Formula: Tax Buoyancy = (% Change in Tax Revenue) / (% Change in Nominal GDP)
- A buoyancy of 1 implies revenues match GDP growth; above 1 signals a robust system (e.g., via aggressive reforms); below 1 warns of leakages, evasion, or structural weaknesses.
- In India, post-2017 GST, buoyancy for direct taxes has hovered around 1.2-1.5, reflecting digitization's boost.
Tax Elasticity
- This measures the percentage change in tax revenue resulting from % change in the tax base—such as national income, consumption, or profits—while keeping tax rates and structures constant.
- It's about the inherent sensitivity of the tax system to economic expansion or contraction, without any government interventions like rate adjustments or new exemptions. For example, if personal income taxes are elastic, a boom in wages naturally boosts collections proportionally (or more).
- The formula is straightforward: Tax Elasticity = (% Change in Tax Revenue) / (% Change in Tax Base)
An elasticity greater than 1 means revenues grow faster than the base (progressive taxes like income tax often score here), while less than 1 indicates sluggish response (common for regressive taxes like sales tax).
These concepts emerged in the mid-20th century amid post-WWII reconstruction, when economists like John Kenneth Galbraith and international bodies like the IMF began analyzing why some tax systems thrived while others lagged.
Elasticity gained traction in developed nations for its focus on automatic stabilizers (taxes that self-adjust to curb recessions). Buoyancy, meanwhile, became a staple in developing economies, where policy volatility is high—think India's frequent GST tweaks or the US's Tax Cuts and Jobs Act of 2017.
By the 1980s, the World Bank and IMF used them to benchmark reforms: low buoyancy in Latin America prompted base expansions, while high elasticity in Nordic countries justified progressive systems. T
oday, with climate taxes and digital levies on the rise, recent IMF studies emphasize buoyancy for long-term sustainability, noting it often exceeds elasticity due to reforms.
Key Differences
|
Aspect |
Tax Elasticity |
Tax Buoyancy |
|
Focus |
Response to tax base changes (e.g., income) with fixed rates |
Response to GDP changes, including policy shifts |
|
Assumptions |
No discretionary changes; holds structure constant |
Includes rate hikes, exemptions, enforcement improvements |
|
Calculation |
Adjusts for policy neutrality (e.g., via regression models) |
Direct ratio; simpler but holistic |
|
Typical Value |
Often <1 for indirect taxes; >1 for direct |
Varies; 0.8-1.2 in developing economies |
|
Use Case |
Assessing inherent progressivity |
Evaluating overall fiscal health and reform impact |
|
Limitations |
Ignores real-world tweaks; harder to measure |
Can mask structural flaws if buoyed by temporary hikes |
About author

Zinkpot — We Inform, You Perform.
Ask Anything, Know Better
अपना प्रश्न पूछें
-
CBDT Exposes ₹9,169 Crore Fake Political Donation Scam Involving Small Parties, Accountants, and Middlemen
November 10 Overview India's tax department has caught a big scam where people used fake donations to political parties to avoid paying taxes. The Central Board of Direct Taxes (CBDT) found out about a ₹9,169 crore racket. This involved small political parties, accountants, and middlemen who helped cheat the system. The news came out on November 9, 2025, and it's a wake-up call for how some people misuse rules meant for real political funding. Why CBDT Monitors Donations CBDT is the government body that handles income...
-
What is DISTRICT DOMESTIC PRODUCT (DDP)? BENEFITS?
November 05 Introduction Have you ever wondered how we measure a country's economy? We use GDP, or Gross Domestic Product, which shows the total value of goods and services made in the whole country. But what if we zoom into smaller areas, like districts? That's where District Domestic Product (DDP) comes in. It's like GDP but for each district in a state or country. In India, DDP is gaining attention as a way to understand local economies better. This article explains what DDP is, if it's coming soon, its benefits, and why it...
-
Car Dealers Hit by ₹2500 Crore Loss After GST?
September 24 Overview In a major development for the Indian automotive industry, the government announced on September 22, 2025, the complete removal of the GST Compensation Cess, ushering in new GST rates: 18% for small petrol and diesel cars and 40% for larger cars and SUVs. This move has made cars more affordable for customers, especially with the festive season in full swing. However, the decision has dealt a severe blow to car dealers, who are now grappling with an estimated ₹2500 crore loss due to unsold inventory purchased at higher...
-
What Got Cheaper and Costlier After GST Rate Cut 2025?
September 22 GST Rate Reforms 2025: Overview India's Goods and Services Tax (GST) underwent its most significant overhaul since 2017 with the rollout of "GST 2.0" reforms, approved by the 56th GST Council meeting on September 3, 2025. Effective from September 22, 2025 (coinciding with the start of Navratri), these changes simplify the structure from four main slabs (5%, 12%, 18%, 28%) plus cess to a streamlined system: 0% (exemptions), 5%, 18%, and a new 40% slab for luxury and "sin" goods. Tobacco products like...
-
What is Income distance in Finance commission?
September 22 CONTEXT In the context of India's Finance Commission—a constitutional body tasked every five years with recommending how to divide tax revenues between the Centre and the states—income distance serves as a measure of economic inequality among states. As India's 16th Finance Commission gears up to redefine how central taxes are shared among states, one term keeps popping up in policy debates: "income distance." This seemingly straightforward concept is at the heart of ensuring equitable resource...
-
How will India's economy grow?
September 19
-
Difference between Cess and Surcharge
September 09 Purpose Cess: Levied for a specific purpose or fund, such as education, health infrastructure, or road development. Example: Education Cess, Health and Education Cess. Surcharge: Levied to raise additional revenue from high-income individuals or entities, without linking it to any specific purpose. Example: Surcharge on Income Tax for individuals earning over ₹50 lakh or ₹1 crore. Applicability Cess: Can be applied to all taxpayers (individuals, companies, etc.) based on certain taxes like income...
-
About Cess and Different Types of Cess in India
September 09 What Is a Cess? A cess is an additional tax levied on top of an existing tax, such as income tax or excise duty. Unlike normal taxes, which flow into the Consolidated Fund of India for general government spending, cess revenues are earmarked for specific projects and are not kept within the consolidated fund of India, rather are allotted to specific ministries for whom the cess was levied. For example: If your income tax liability is ₹1,00,000, a 4% Health and Education Cess means you pay ₹4,000 extra. This extra...
-
NEXT GEN-GST REFORMS! What are the major changes made in GST 2.0 in 2025?
September 05 Category / Examples Old GST New GST Notes Consumer durables – air-conditioners, dishwashers, TVs (LCD/LED) 28% 18% Rate rationalisation for electronics. Cement 28% 18% Relief for housing & infra. Small cars (≤1200cc petrol/LPG/CNG ≤4000 mm; ≤1500cc diesel ≤4000 mm) 28% 18% Relief for middle class Motorcycles ≤350 cc 28% 18% >350 cc moved to 40%. Three-wheelers (HSN...
-
How GST council's voting and decision takes place?
September 05 The GST Council is established under Article 279A, introduced by the 101st Constitutional Amendment Act, 2016. It functions as a joint forum for decision-making between the Union and the States. Members of GST council include: Union Finance Minister (Chairperson) Union Minister of State in charge of Revenue/Finance State Finance Ministers or their nominees Weighted Voting Structure Decisions are made through a weighted voting system, structured as follows: Central Government holds 1/3 (≈33.33%) of...
- 1 RBI Digital Rupee e₹ क्या है? बिना Internet पेमेंट! कैसे इस्तेमाल करें Digital Rupee vs UPI April 15
- 2 About Trade Policy Uncertainty (TPU) Index and Global Economic Policy Uncertainty (GEPU) Index April 08
- 3 What is Food Credit and Non Food Credit? April 08
- 4 SARFAESI Act, 2002 Vs Insolvency & Bankruptcy Code (IBC), 2016 : Main Differences April 08
- 5 IN Skip navigation Search Sign in Transgender Bill 2026: क्या अब डॉक्टर तय करेंगे आपकी पहचान? NALSA से अब तक पूरा मामला April 01
- 6 80 लाख लोग सड़कों पर March 31
- 7 Iran US War: Strait of Hormuz के बाद Bab al-Mandeb Strait बंद हुआ तो दुनिया रोएगी | Zinkpot March 28
- 8 LPG vs CNG vs PNG | कौन सी गैस सबसे SAFE? Gas Crisis | Iran War | Zinkpot March 27
- 9 IPL 2026 सबसे बड़ा महामुकाबला । Maximum Teams, Prizes and Matches l Zinkpot March 26
- 10 Iran War 2026: ट्रंप की 48 घंटे की डेडलाइन खत्म… अब क्या होगा? March 25
- 11 USA LOST Dubai Trust? | Dubai अब Safe नहीं? | Iran War | ZINKPOT March 25
- 12 “मैं जिंदा हूं” – Netanyahu | Iran Nuclear Power खत्म? | IRAN War Update March 21
- 13 Iran war: Larijani killing Revenge | Iran Bombards Saudi Oil Refineries | Is this World War - 3 March 20
- 14 Israel–Iran Conflict Explained | क्या ये धर्म की लड़ाई है? | Middle East War Analysis March 19
- 15 IRAN WAR: TRUMP बेबस | Trump ने China से मांगी मदद | Strait of Hormuz संकट । Geopolitics March 17
- 16 Iran vs USA War: Operation Epic Fury पर उठे सवाल | Trump की बड़ी रणनीतिक गलती? March 16
- 17 IRAN WAR: Mojtaba Khamenei’s First Message | “हर मौत का बदला होगा” US-Israel को खुली चेतावनी March 14
- 18 IRAN WAR: जंग की लपटें रसोई तक | LPG CRISIS का संकट ! आख़िर कब तक March 13
- 19 IRAN WAR: AMERICA BLIND | क्या US Radar अब बेकार? March 12
- 20 What does Trump want from Iran? March 11
Comments
Write Comment